3D Lung Segmentation
3-Dimensional Lung Segmentation Using Deep Convolutional Neural Networks
Introduction
Current developments in deep learning algorithms use neural networks to perform complex feature extraction. This is used to analyze medical data accurately and generate multiple sets of analysis. The U-Net architecture is found to outperform other network architectures for biomedical image segmentation. Evaluations have been completed on the extension of the U-Net architecture, the Recurrent Residual Convolutional Neural Networks (R2U-Net), in different fields of medical imaging. The network has demonstrated better performance in 2D medical image segmentation against other state-of-the-art networks. We have modified the R2U-Net into a 3D architecture and have achieved excellent qualitative and quantitative segmentation results.
Goals/Objectives
- Segment the lung in three dimensions using deep learning
- Determine the feasibility of the detection of the pulmonary nodules.
- Find the testing effectiveness and efficiency as compared to a subject matter expert
Methodology
3D R2U-Net Architecture
The network architecture is illustrated in Figure 1. It consists of a contracting/encoding path (left side) and an expansive/decoding path (right side). The contracting path follows the typical architecture of a convolutional network. It consists of the repeated application of two 3 x 3 x 3 convolutions, each followed by a rectified linear unit (ReLU) and a 2 x 2 x 2 max pooling operation with stride 2 for down-sampling. At each down-sampling step, we double the number of feature channels. Every step in the expansive path consists of an up-sampling of the feature map followed by a 2 x 2 x 2 up-convolution that halves the number of feature channels, a concatenation with the correspondingly cropped feature map from the contracting path, and two 3 x 3 x 3 convolutions, each followed by a ReLU. At the final layer, a 1 x 1 x 1 convolution is used. The convolution layers use various number of filters (16, 32, 64, and 128) in 3D R2U-Net. We have applied the dilation in encoder and in Recurrent Convolution Unit. The neural network contains 42 convolutional layers, having 3,250,305 trainable parameters in total.
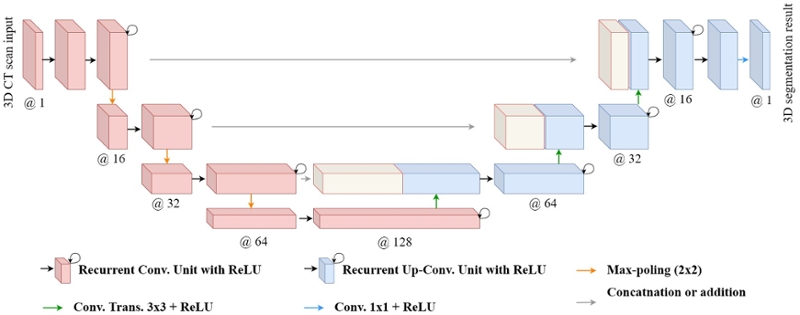 Fig. 1. 3D R2U-Net architecture with convolutional encoding and decoding unites using recurrent and residual convolutional layers (RRCL) based U-Net architecture.
3D Convolutional Neural Network Concept
The proposed work will use 3D patches as an input to the architecture. 3D Convolution operations are used to find 3D features for 3D segmentation. Figure 2(a) shows the 2D convolution used in original R2U-Net. The proposed 3D convolution structure is depicted in Figure 2(b).
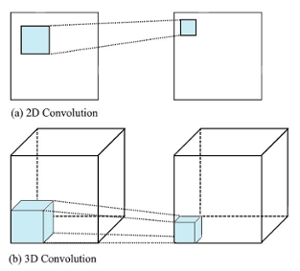 Fig. 2. Comparison of (a) 2D convolution and (b) 3D convolution
Loss Functions
We have used the original version of the Dice Coefficient (DSC) and evaluated results on two different Dice Coefficients (DSC and DSC_SQ) to measure overlap volume between predicted segmentation and binary ground-truth.
Results/Evaluations
We have used dataset LUNA16 (Lung Nodule Analysis 2016). It contains 877 CT scans of size (Slice, 512, 512) where Slice is varying. The CT scans are in MHD format, and we have used NiBabel package for reading these files. The scans are scaled into the shape of (144, 144, 144) so that they can be trained on the proposed neural network. The scans are single-channel data that are normalized from 0 to 1. We have trained the neural network with 800 scans and tested the results on 77 scans.
We have trained the neural network with 800 scans and tested the results on 77 scans. Table 1 shows two Dice Coefficients, calculated on predictions using two different versions. Figure 3 shows the 3D prediction and binary ground-truth for the same CT scan. Figure 4 shows all of the slices of the CT scan, and the same for predicted segmentation and binary ground-truth in Figure 5 and Figure 6, respectively.
Table 1. Dice Coefficient Scores for the 3D R2U-Net on the LUNA16 dataset
![]()
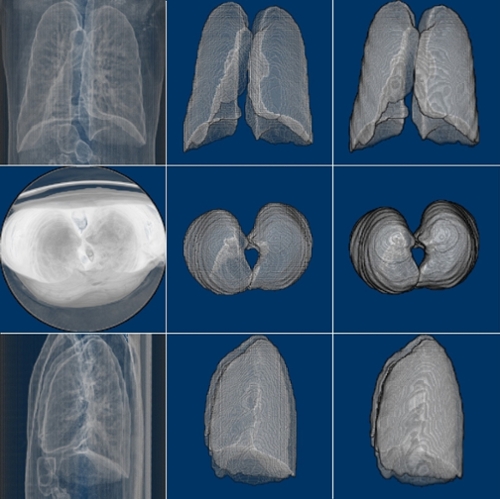 Fig. 3. CT scan, predicted segmentation and binary ground-truth (3D visualization using ImageJ).
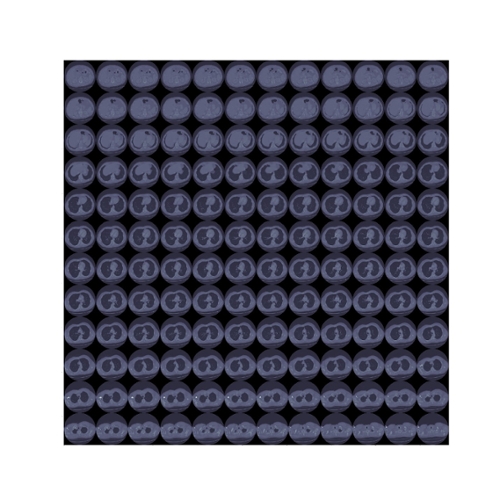 Fig. 4. Slices of a lung CT scan used for evaluating the 3D R2U-Net architecture.
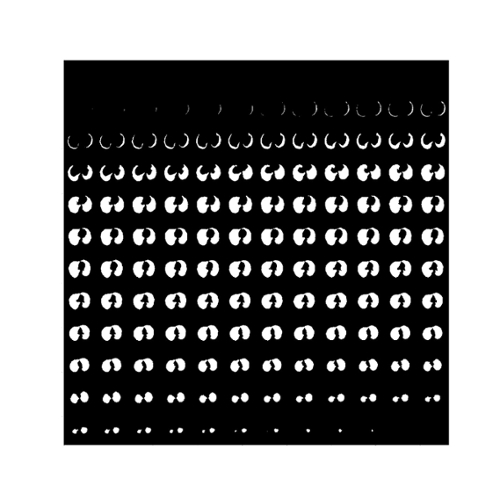 Fig. 5. The predicted segmentation of the Lung tissue regions using 3D R2U-Net.
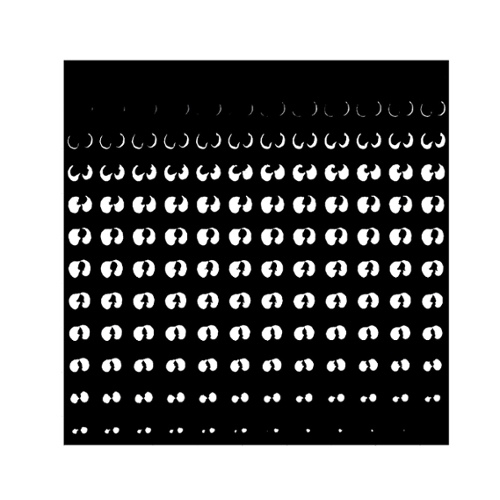
Fig. 6. The binary ground-truth of a lung tissue region in the LUNA16 dataset.